Excel – Intersection: What is it? Why
is it useful?
The following dataset displays the
number of juvenile delinquency cases opened in four US states during the year
2020. (not really, the data are fabricated 😊 )
Pic 1: the dataset
Now, suppose you want to analyse the dataset.
For example:
How many cases were opened in Californian in May?
This can easily be solved in various
methods,
for example, with the following formula:
Or with this one:
Pic
3: Another "traditional" solution
However, there's a far better, much simpler
method in Excel for cross tab data.
Unfortunately, it is lesser known. It
is called Intersection.
The intersection Operation is ideal when dealing with cross tab data: a column
data intersecting a row data.
The intersection operation does not
refer to cells or ranges, but to names.
So, how do we use this feature?
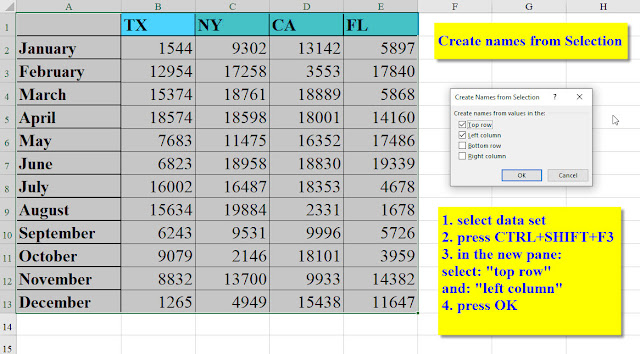
First of all, we need to define the
names (taken from cells B1:E1, the column headers and from cells A2:A13, the row headers)
So, we Create names from selection as
explained in the picture:
Pic 4: Create Names from Selection
If we take a close look at the definitions
created in the Name Manager, we can clearly see that each State has 12
values (the values of the 12 months) and that each month has four values (one
for every state).
Pic
5: Name Manager's definitions
And now let's turn to some cool applications
of Intersection.
Example No.1:
Remember the
question we asked ourselves at the beginning?
How many cases were opened in Californian in May?
So, instead of a lengthy formula, we can
have the solution in a very short formula:
=CA May
The formula consists of two elements:
the column (CA) and the row (May), separated by the intersection operator
" ".
So simple, so easy, so obvious….
Example No.2:
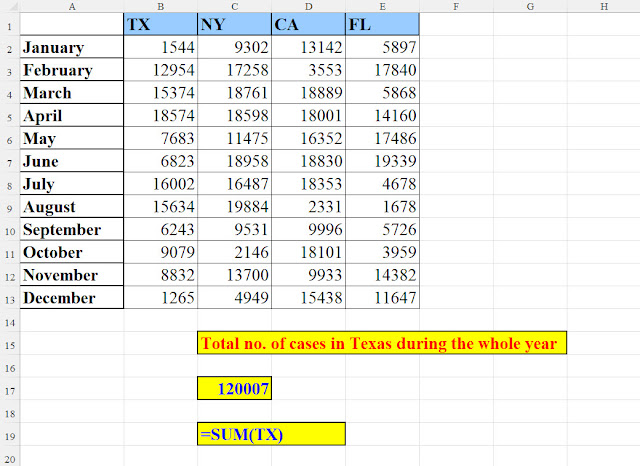
How many cases were opened in Texas
alone during the entire year?
Pic 7: How
many cases were opened in Texas during the entire year?
Example No.3:
How many cases were opened in Texas in
the first 4 months?
Pic 8: How many cases were opened in Texas
during Jan.-Apr.?
Example No.4:
How many cases were opened in Texas and
California in the first 4 months?
Pic 9: No. of cases opened in Texas & California in Jan-Apr
Example No.5:
How many cases were opened in January
(excluding Texas)?
Pic 10: How many cases were opened in January (excluding Texas)
Example No.6:
Total cases in Texas, California and
Florida (altogether)
Pic 11: Total cases in Texas, California
and Florida (altogether)


אין תגובות:
הוסף רשומת תגובה